Great, but does it actually work?
In an age where data-driven personalization is redefining how we learn, Adaptive Learning Systems are delivering significant improvements to education by adjusting content and learning paths based on real-time learner data.
The question customers want answered is: How will we know it actually works?
What are the hard numbers that you can use to evaluate the effectiveness of these systems? This post will walk you through The Six Core Metrics you should use — explained both in academic terms (with citations) and in super plain English (for the rest of us).
(There are, of course, many considerations teams need to take into account when selecting an Adaptive Learning Vendor including Cost, Time To Impact, Data Security and more; but today I want to share a framework for evaluating the effectiveness of Adaptive Learning Systems (ALS) themselves by focusing on the metrics that matter.)
Why Metrics Matter
The success of Adaptive Learning doesn’t just lie in “personalization” claims — it lies in measurable outcomes. A system can be highly personalised, but still ineffective after all.
1. Learning Gain (Knowledge Improvement)
The Research
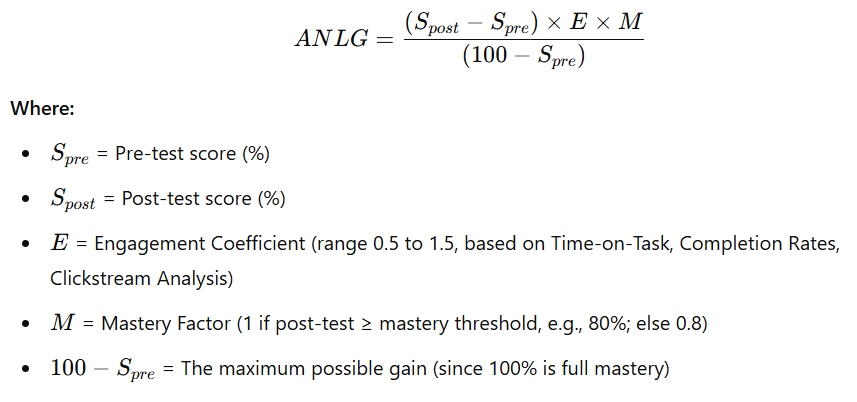
Learning gain is typically measured as the difference in performance between pre-test and post-test assessments (VanLehn, 2011). In Adaptive Learning contexts, this gain is often normalized using effect size metrics like Cohen’s d to allow for meaningful comparison across populations (Haahr & Mislevy, 2022). Haug et al. (2024) reported that students using an AI-based adaptive system showed an average of 23 percentage points improvement in assessment scores, significantly higher than control groups using traditional e-learning. The formula for Adaptive Normalized Learning Gain (ANLG) is as follows:
The Metric: Learning Gain
Benchmarks
| System Type | Description | Typical Learning Gain (Percentage Point Increase) | Academic/Industry Evidence |
|---|---|---|---|
| Non-Adaptive E-Learning | Static digital content, same pathway for all learners | 5–10% | VanLehn (2011); Haahr & Mislevy (2022) |
| Branching / Rule-Based Personalisation | Conditional content pathways, manual rule trees | 10–18% | Wolf & Gibson (2020); Santos et al. (2019) |
| Model-Based Adaptive Learning | AI-driven, dynamic learner modeling and real-time adaptation | 18–30% | Haug et al. (2024); Adaptemy (2023); Feng et al. (2009) |
In Plain English
How much smarter are students after using the system? Are they actually learning faster and better than other systems — or just clicking through the content?
2. Time Spent In Flow
The Research
Flow Theory, first conceptualized by psychologist Mihaly Csikszentmihalyi (1975, 1990), describes a psychological state of deep absorption and optimal experience in which individuals are fully immersed in an activity. In this state, learners experience intense focus, intrinsic motivation, and a sense of control, often losing awareness of time and external distractions. According to Csikszentmihalyi, flow occurs when there is an ideal balance between the challenge of the task and the skill level of the individual. This equilibrium prevents both anxiety (when challenges exceed skills) and boredom (when skills exceed challenges), fostering sustained engagement and deeper cognitive processing.
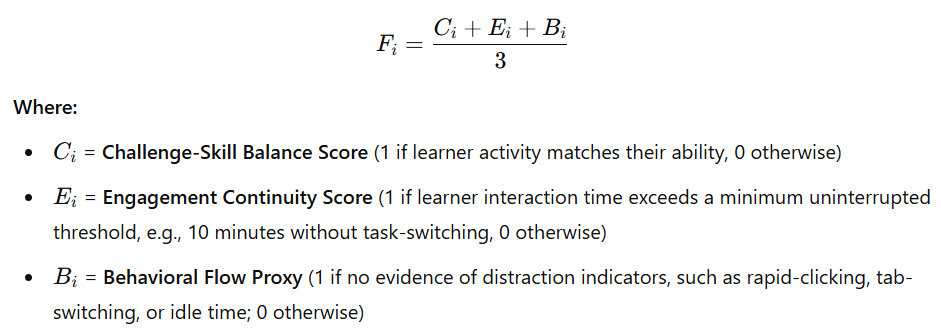
The theory identifies nine dimensions of Flow, with three commonly used as measurable proxies in digital learning environments:
-
Challenge-Skill Balance
-
Clear Goals and Immediate Feedback
-
Concentration on the Task at Hand
In Adaptive Learning Systems, fostering flow is particularly crucial because the system’s primary function is to continuously match content difficulty to learner capability in real time, thereby optimizing conditions for flow and maximizing both engagement and knowledge retention.
The Metric: Time Spent in Flow
In Plain English
Flow is the mental state where you’re “in the zone” — completely focused, challenged but not stressed, learning without noticing the time pass. It is provably the best ‘state’ to learn in. Adaptive Learning systems work best when they can keep learners in this sweet spot. What percentage of learner’s time is spent in the flow zone?
3. Engagement
The Research
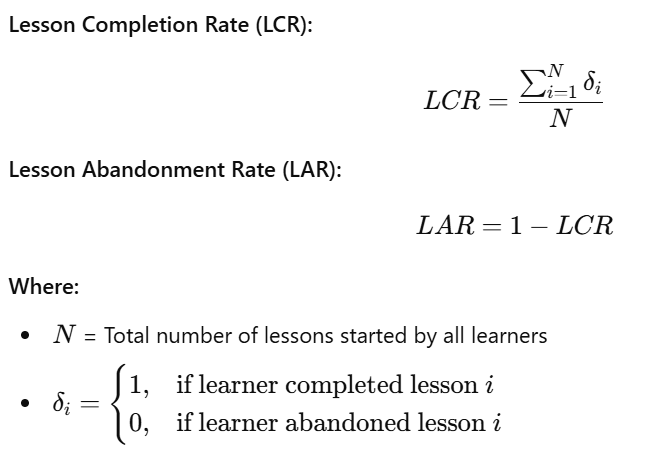
Engagement is a multi-dimensional construct encompassing behavioral, emotional, and cognitive involvement in learning activities (Fredricks, Blumenfeld & Paris, 2004). In adaptive systems, engagement is often operationalized through completion rates, time-on-task, and interaction patterns (D’Mello & Graesser, 2015). Higher engagement in adaptive systems has been positively correlated with persistence and course completion rates (Santos et al., 2019).
The Metric: Lesson Completion Rate / Abandonment Rate
In Plain English
“Usage” can mean a lot of things, including time spent (But are they actively learning or just logged in?) High lesson completion rates prove that the learners are kept engaged through the entirety of the journey unto completion: A key goal for personalised Adaptive Learning Systems.
4. System Accuracy (Prediction & Adaptivity)
The Research
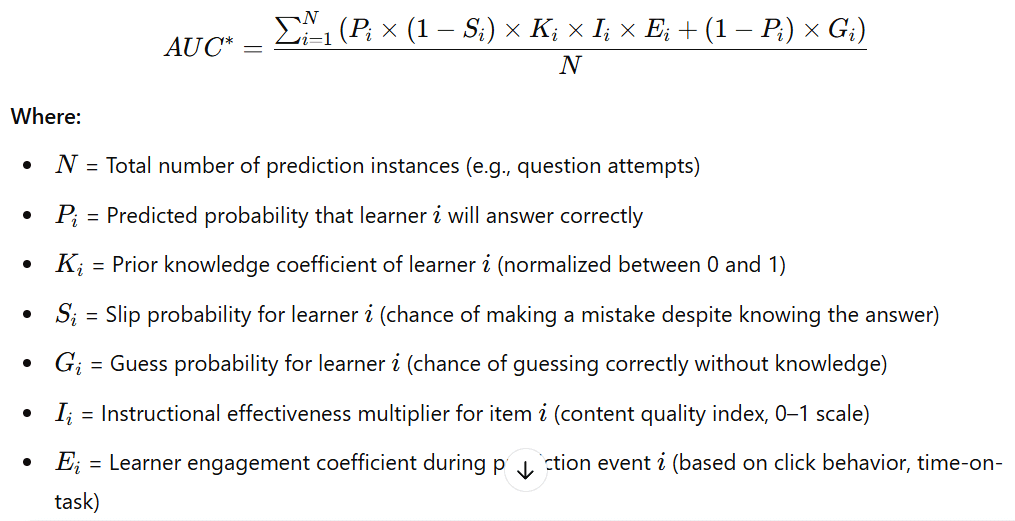
System accuracy refers to the adaptive engine’s ability to accurately predict learner knowledge states and behavior (Corbett & Anderson, 1995). This is measured through predictive validity metrics such as Area Under the ROC Curve (AUC) or precision/recall scores.
The Metric: AUC (Area Under ROC Curve)
In Plain English
Prediction Accuracy is a higher-order metric: If the system is accurately predicting user behaviour then all of the underlying models are finely tuned and working harmoniously. Only when a system can accurately predict when a learner will struggle, or when they will succeed, can it begin to deliver effective recommendations.
5. Explainability
The Research
Explainability (or Interpretability) in Adaptive Learning refers to the system’s ability to make its instructional decisions transparent and understandable to human stakeholders — including educators, administrators, and learners (Doshi-Velez & Kim, 2017), (Ghergulescu & Huat, 2023).
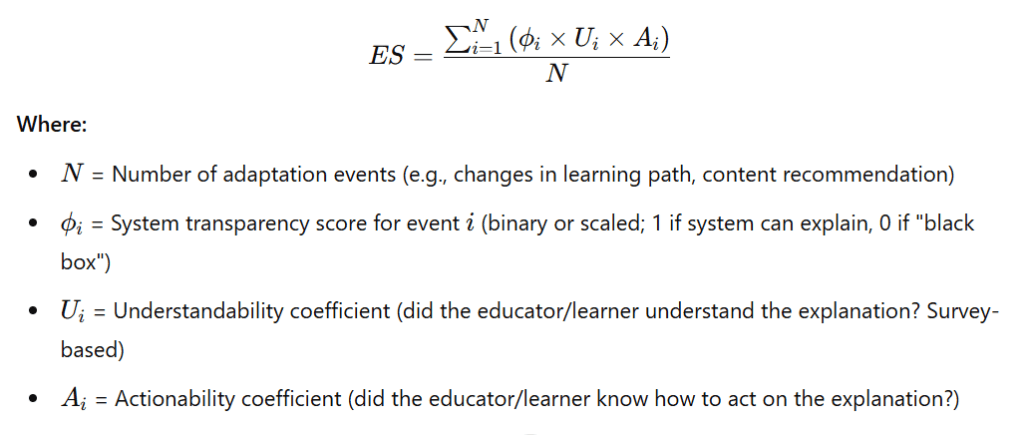
The Metric: Explainability Score
In Plain English
Users cannot trust a system they do not understand. Adaptive Learning Systems should clearly communicate to learners and educators why they are being recommended a specific next step.
6. Learner Satisfaction
The Research
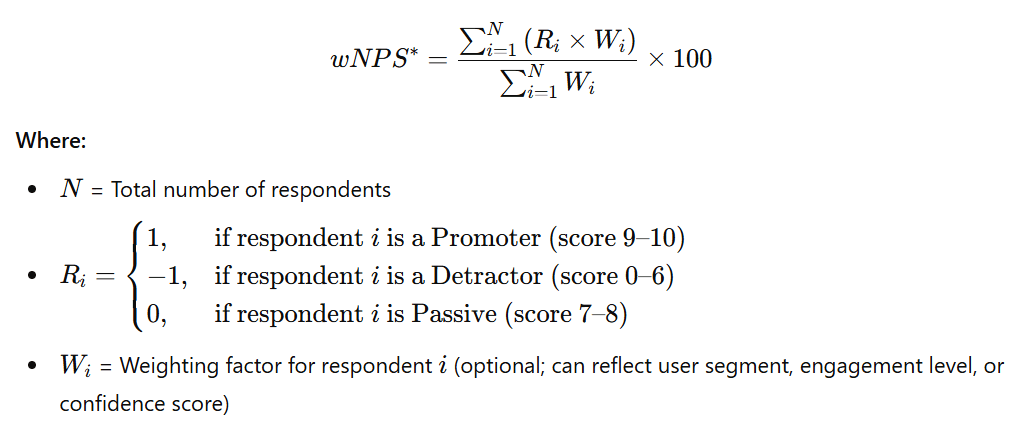
Learner satisfaction is measured via standardized instruments such as the Learner Satisfaction Survey (LSS) or Net Promoter Score (NPS) adapted for learning environments (Moore, 2021). High learner satisfaction has been linked to better engagement and higher learning outcomes (Sun et al., 2008). A recent survey of adaptive system users reported that 92% of learners preferred adaptive learning environments over static digital content (Adaptemy, 2023).
The Metric: Net Promoter Score
In Plain English
Would user’s recommend the system to their friends? Usage and engagement are great indicators, but behind those numbers: Are users enjoying the experience or trudging their way through lesson after lesson? A word of caution on this one: NPS for Educational products is overwhelmingly lower than for other consumer products.
In Conclusion
When evaluating Adaptive Learning systems: Ask for the data, the evidence, and the metrics that demonstrate real, scalable learning outcomes. Because if you can’t measure it — you can’t improve it.
